Your app, live in 3 minutes. From Claude Code, Codex, Cursor, GitHub Copilot, GitHub or a folder. Light Cloud hosts the frontend, the backend and a Postgres database in one place.
Send me the link for my desktopSee it work
The console, in sixty seconds.
Create an app from a repo, organise it in folders, deploy, add a domain, read the logs, watch the metrics and see the bill. The tour below is the real console, drawn.
What you get
Everything an app needs, nothing to assemble.
Screens from the console, not mockups. The same thing you see after you sign up.
Create
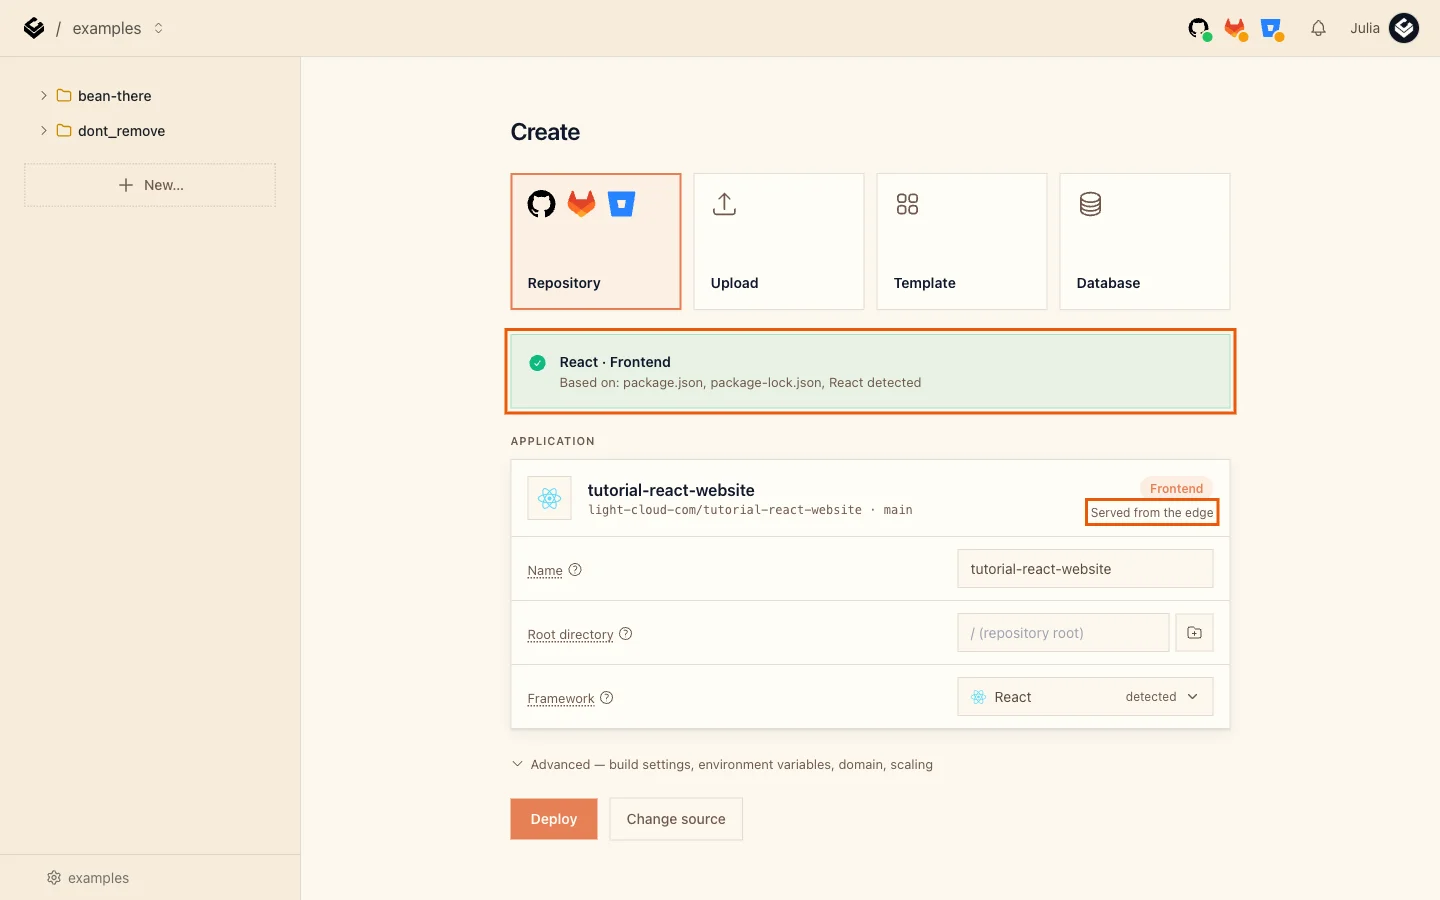
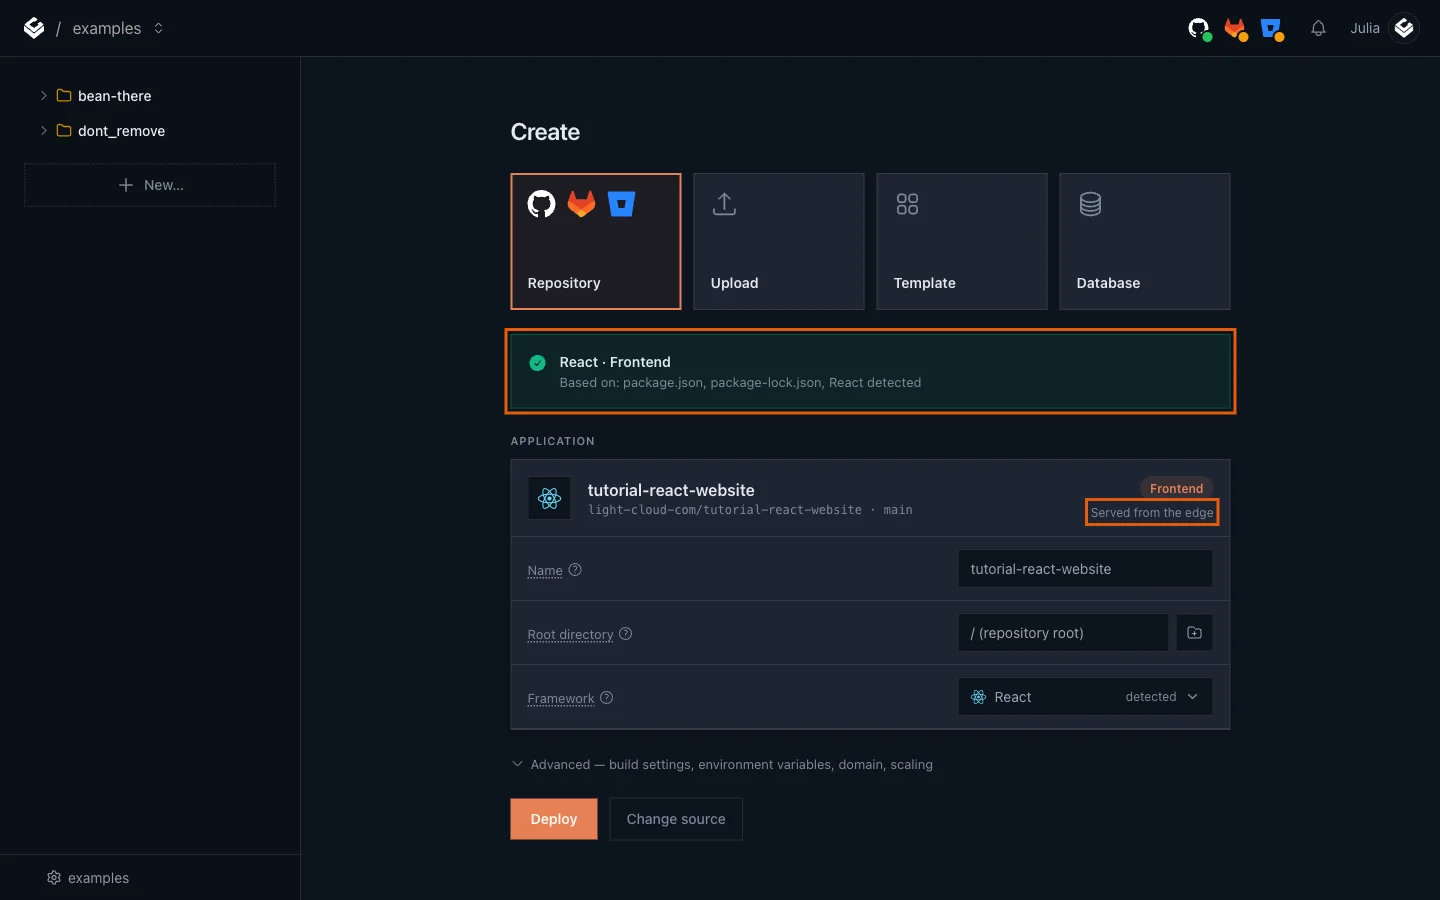
Pick a repo. The framework is detected.
Connect GitHub, GitLab or Bitbucket, or upload a folder. Light Cloud reads the code, names the framework and the build, and asks nothing else. One click to deploy.
React, Next.js, Vue, Svelte, Django, Go, Rails, Spring, .NET, Dockerfile
Deploy
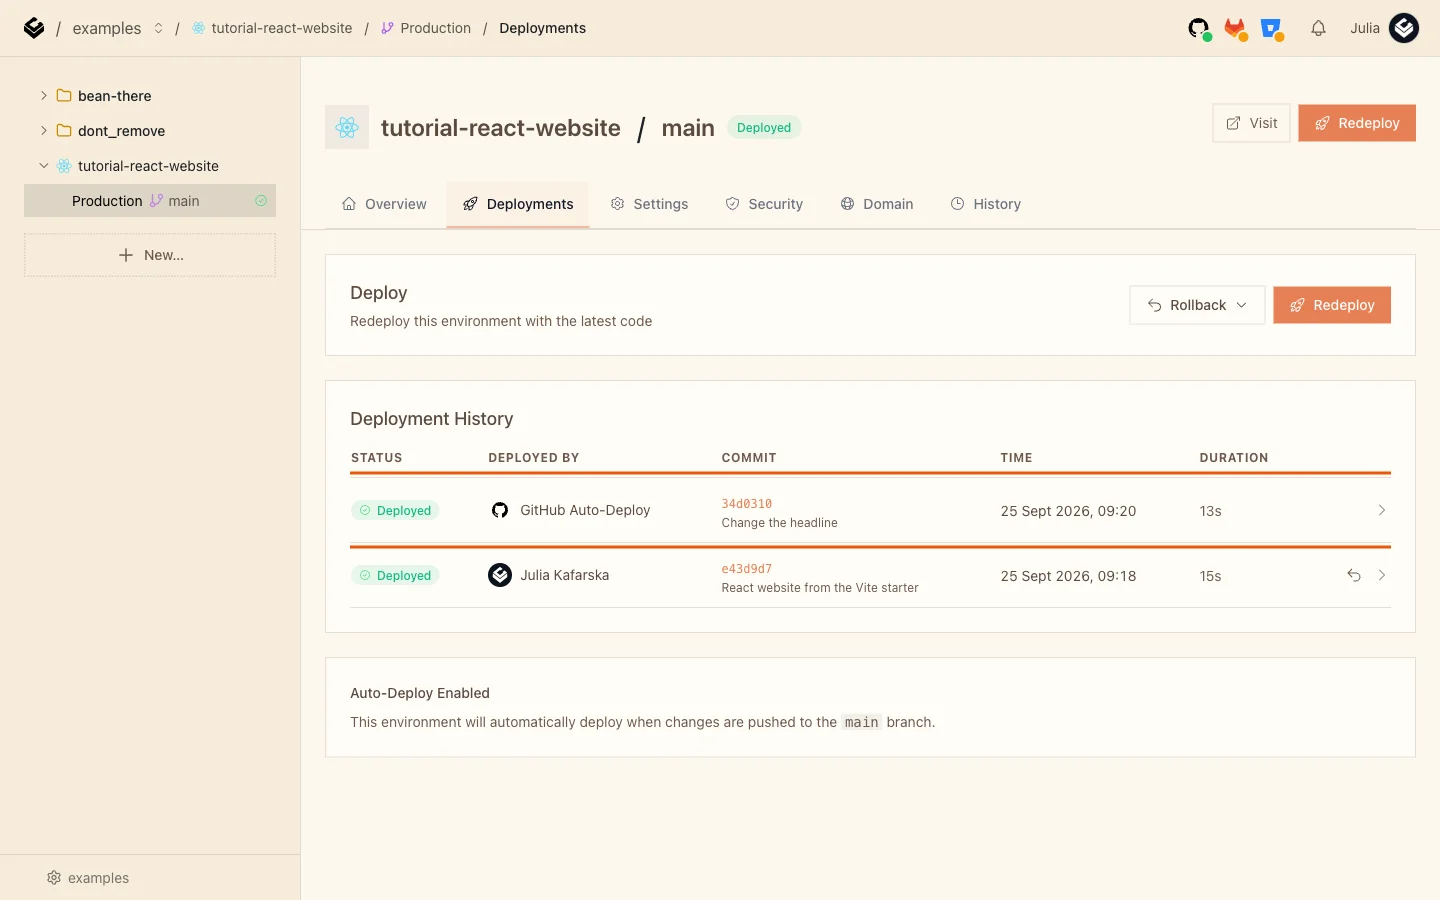
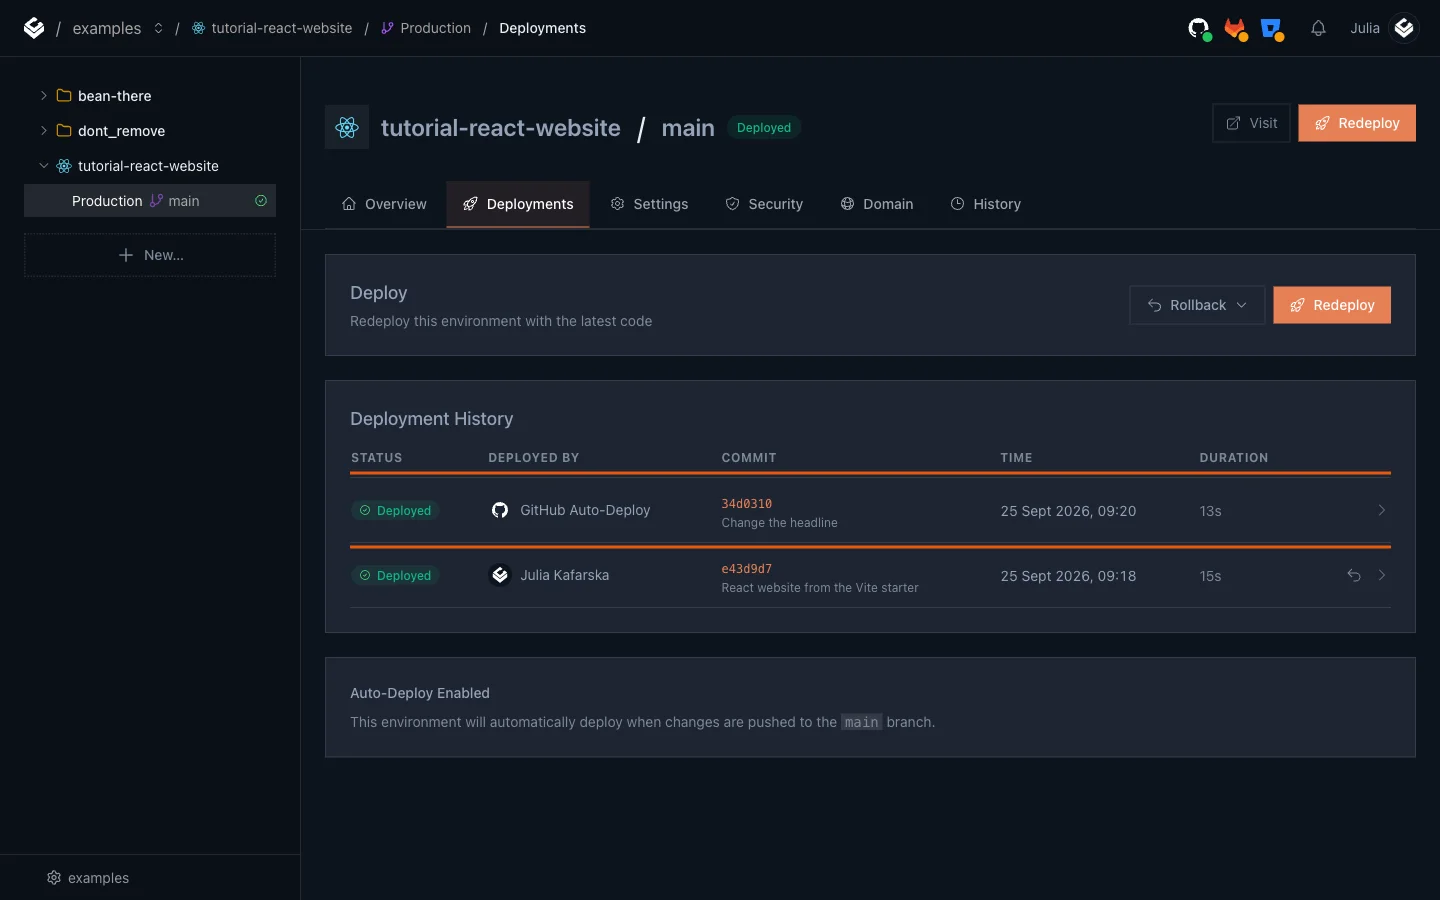
Every push goes live. Every deploy can roll back.
After the first deploy, a push to the branch builds and ships on its own, with the commit, the author and the build time kept for each one. Rollback is a click.
Build 13s · auto-deploy on push · rollback
Database
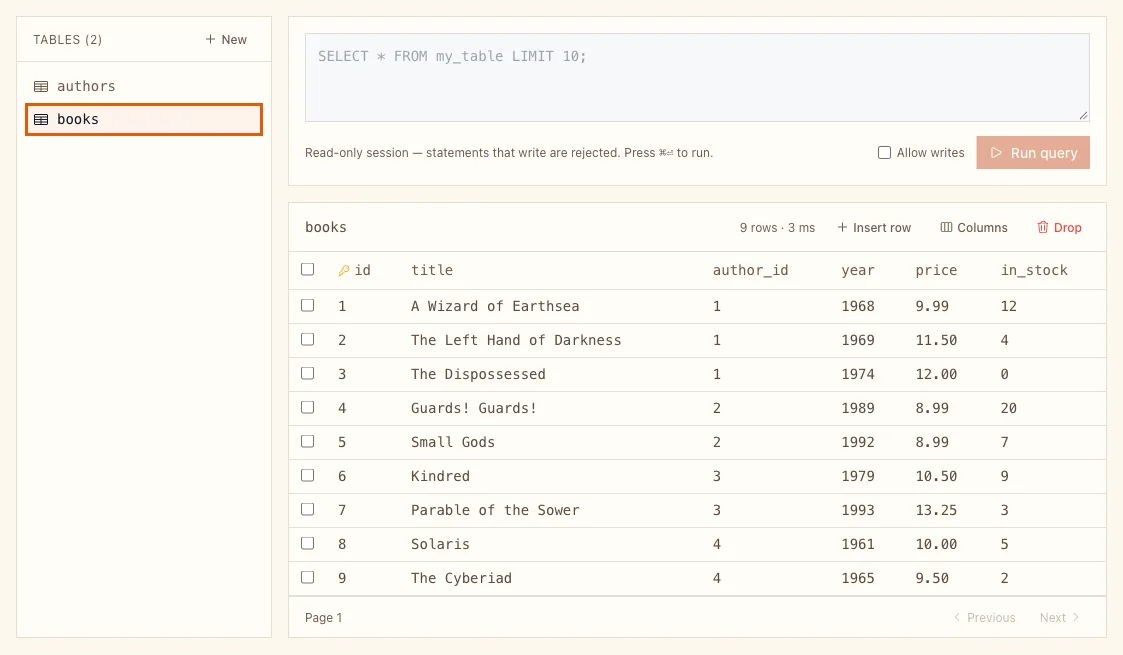
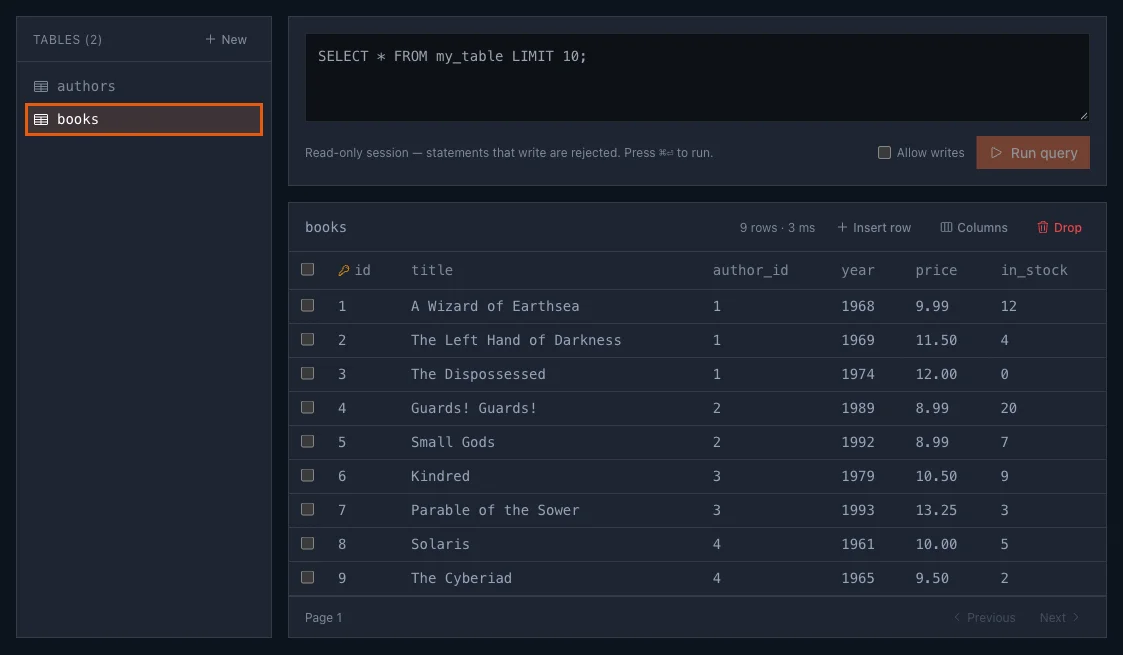
Postgres next to the app, with a data explorer.
Create a database in the same project, get the connection string wired into the app, and browse tables or run a query without leaving the console.
Shared from about $4 a month · dedicated from $9
Observe
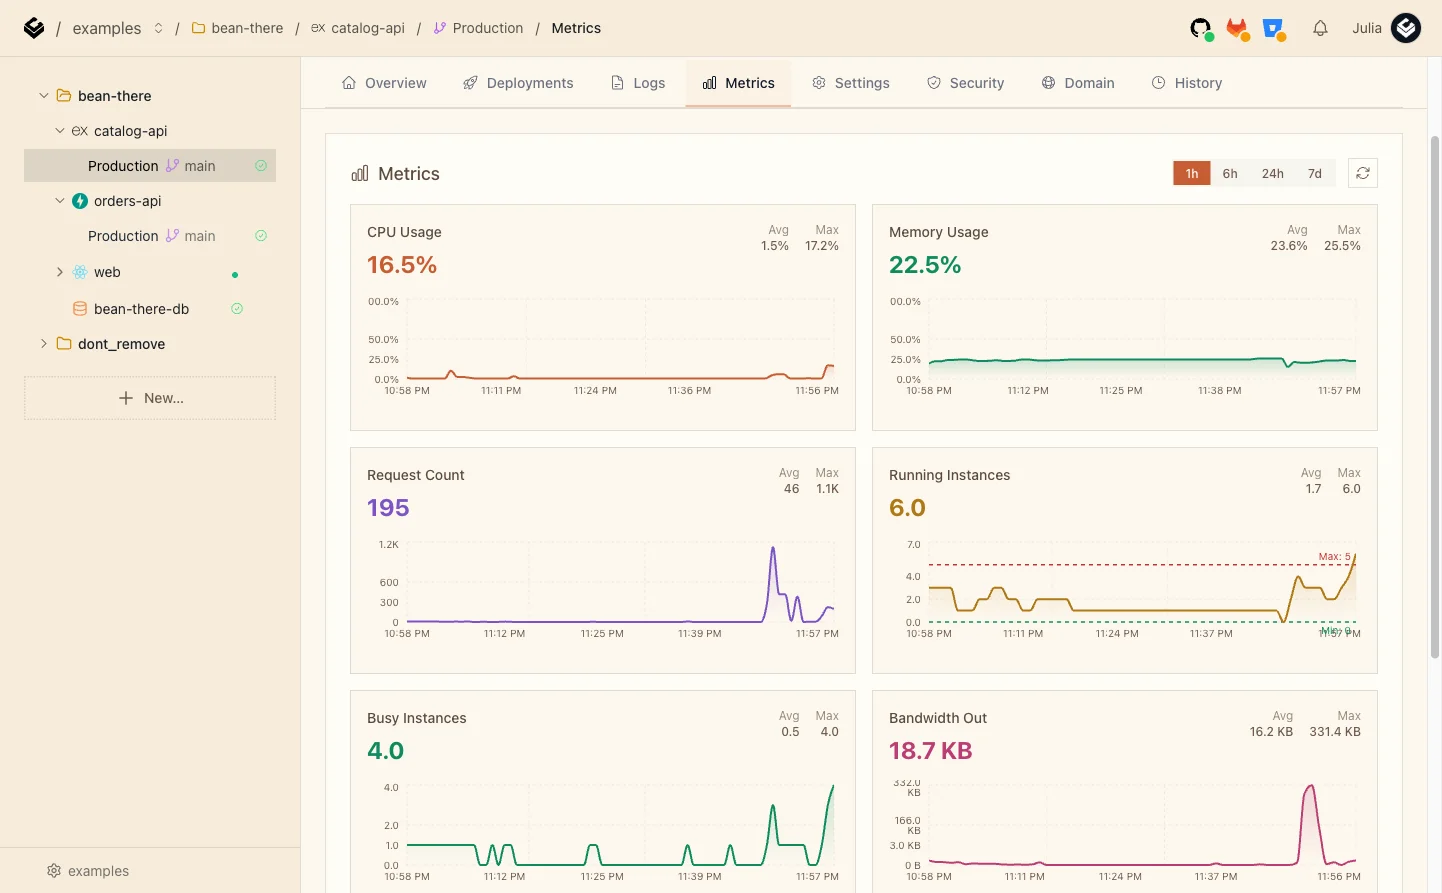
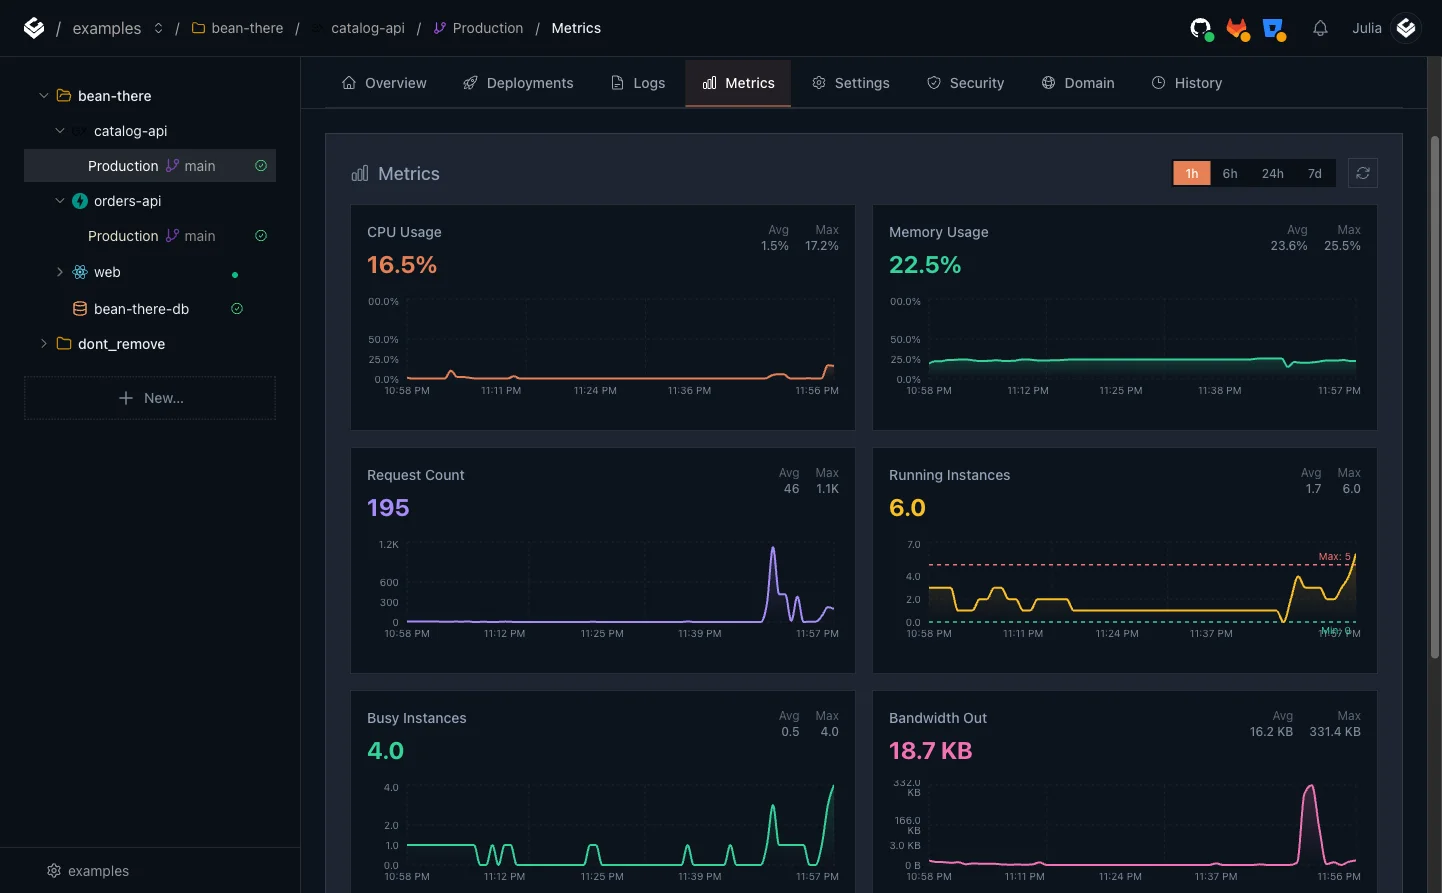
Logs and metrics where you deploy.
CPU, memory, requests and running instances per environment, next to the live log stream. Idle apps scale to zero and the chart shows it.
Scale to zero · live logs · per environment
PROJECT-DEMO · PRODUCTION
Frontend
global CDN
Deployed
Backend
container
1 instance · scales to 0
Postgres
10 GB · europe-west1
Credentials wired
Full stack
Frontend, backend, and a database in one place.
Static sites go to a global CDN. Containers scale to zero when idle. Postgres sits right next to them, provisioned from the same project.
- Static and containers
- Ship a static site to the CDN or a container to Cloud Run. Light Cloud reads your repo and picks the target.
- Managed Postgres
- Provision a database with a tier, region, and storage size. Credentials are encrypted and wired to your app.
- A preview per branch
- Every branch and pull request gets its own URL, built on push and removed when the branch is gone.
- Scale to zero
- Idle containers stop billing. You pay for the time your app actually runs.
Deploy with AI
Deploy from Claude Code. One command to install.
Then ask "Deploy this project to Light Cloud." Claude signs you up if you have no account, asks two questions, and hands back a live URL. The same MCP server works in GitHub Copilot and Claude Desktop; the CLI does it from a shell.
claude mcp add light-cloud -- npx @light-cloud/mcp-server
Pricing
Unlimited sites. Three apps. $0.
Free includes $1 of usage a month with no card. A typical site uses about a cent of it; if you ever use it all, server apps pause and your sites stay up.
Add what you run. Watch it stay free.
Unlimited on every plan.
I also need
LIGHT CLOUD
USAGE THIS MONTH
| 50 × static site | $0.50 |
|---|---|
| 5 × preview URL | $0.10 |
| 3 × server app | $0.30 |
- Usage
- $0.90
Each line assumes
Static site: 1 deploy a month (the measured median), a 1-minute build at $0.01 a minute. Bandwidth included up to 20 GB a month per workspace on Free, 1 TB on paid plans.
Preview URL: 2 builds a month, 1 minute each.
Server app: 2 deploys a month (2-minute builds). Billed only while serving: 200 ms a request on Micro at $0.12 an hour.
Database: Shared Postgres or MySQL, $4 a month each.
$1.00 included
- Plan FREE
- $0.00
Never billed. At $1 of usage, server apps pause; sites stay up.
Start free, no cardFrom the Labs
ICE, an open-source visual cloud editor
Design cloud infrastructure on a canvas, preview the cost, and deploy to your own cloud accounts. ICE and its blocks and templates are free and PolyForm Noncommercial 1.0.0.
Deploy your first app today
Push a repo, upload a folder, or ask your assistant. Free for unlimited sites and three apps, no card. Or book twenty minutes and we deploy it together.